Corona virus and coronavirus the number of cases in Turkey came 18th! There are many official sources that transmit corona virus last minute information. There are also great sites that share data about countries with coronavirus. Google and Bing search engines are among the top sites that share last minute information and show protection ways. Corona virus map offers much more detailed and real-time data. In this blog post, we share the 8 best coronavirus maps for Corona virus tracking.
Turkey's largest city of Wuhan in China starting up from Covidien-19 (new type of corona virus) epidemic is taking hundreds of lives every day. According to the official data announced by the Minister of Health in our country, it is stated that the corona virus case 18 and the necessary precautions are taken now and the road map is drawn. The worldwide epidemic is expected to lose its effect towards the summer months. As of March 16, the number of people affected by this virus is 171 thousand and this number is gradually increasing. There are many local and foreign sources where we can get the last minute information of Corona virus , as well as there are sites that share data instantly on the map. Corona virus map Through which the virus is seen, how many people affected, how many deaths occurred, how many people were treated, how the Corona virus got infected, how it spread, in short, everything about the Corona virus can be tracked in real time.

Bing Covid-19 Audience shows active cases, treated cases and fatal cases worldwide and country-wide. The countries affected by the new type of corona virus are both listed and you can see them by clicking on the map. You can also read the latest coronavirus news for each country. The data are collected through the World Health Organization (WHO), the US Centers for Disease and Prevention (CDC), the European Center for Disease Prevention and Control (ECDC), and Wikipedia.

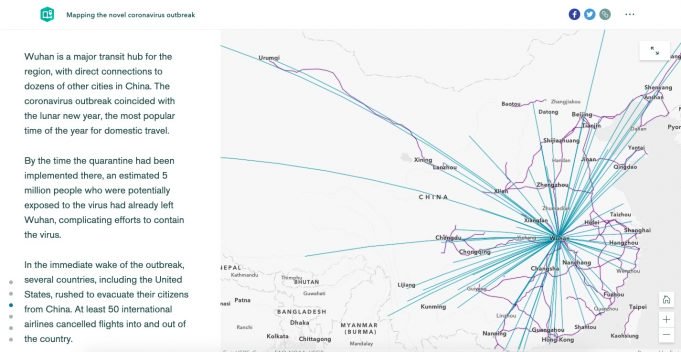
Esri Story Maps , one of the mapping outbreaks of the new type of corona virus (Covid-19) , updates the corona virus map and graphics daily. In addition to deaths, it shows in depth how the virus developed in Wuhan, how it spread afterwards, canceled flights and much more data. It also provides information such as what is the Corona virus, how the disease spreads, how it differs from other diseases like SARS, MERS.

The situation table of the World Health Organization provides the latest updates on the new coronavirus outbreak. It includes the number of infected people, deaths occurred, affected countries and other data on the Covid-19 outbreak. The source of the data on this dashboard built on the ArcGIS platform is WHO (World Health Organization); Therefore, we can say that it is the most accurate source.

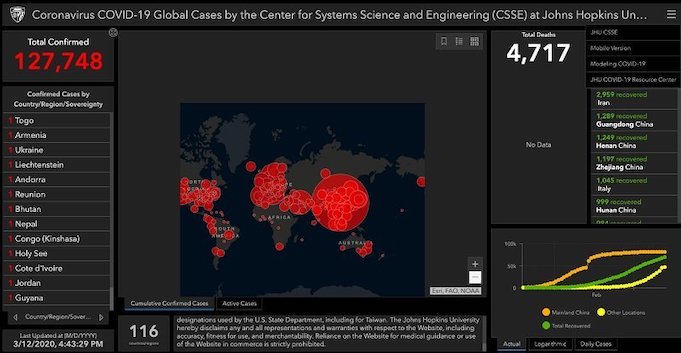
The map, released by the Center for Systems Science and Engineering at Johns Hopkins University , is the first map showing new types of corona virus Kovid-19 cases worldwide. Statistics may not be fully accurate because the website is based on public data from multiple sources. It offers a real-time view of the total number of confirmed cases and statistics of recovered cases and active cases (with number locations) in addition to giving affected countries. Esri is based on the ArcGIs platform.

HealthMap is a nonprofit Boston Children's Hospital program that tracks communicable diseases. The digital map tracks the spread of the new coronavirus in real time using artificial intelligence, giving people, governments and health workers an updated picture of the outbreak spread. It was created by MapBox on the OpenStreetMap platform.

To explore innovative methodologies to develop geospatial technologies taking into account human experience; to reflect on the geographical visualization of maps and the social effects of other geospatial technologies; A new type of coronavirus (COVID-19) Infection Map from the Washington University lab, which works in a region to geographically describe various geographical events, especially those related to the vulnerable population , affected people, countries, deaths, etc. In addition to its absolute number, it offers different tabs to track levels of infection and communities. It was created on the CARTO DB platform and there is a satellite view option for the map.

The University of Virginia 's Kovid-19 Oversight Control Panel has been offering a timeline to view the progression of the disease since January 22, 2020. There are different tabs: effective, approved, healed and dead. The website claims to use a number of open source data sites. It also features a special tab to track Covid-19 cases outside of China mainland.

The Covid-19 Corona virus tracking site of the Kaiser Family Foundation , a non-profit San Francisco organization working in the field of providing independent information on health problems in the United States , the number of new coronavirus cases and deaths by country, the number of deaths by country, the trend in cases and the case and a global map showing the countries where deaths occurred. The data are taken directly from the official COVID-19 status reports, regularly published by the World Health Organization. The site is updated as we publish new status reports. Tabs are available to display data by country.